GerrymanderX app icon Election Atlas · Precinct results 2000–2024

Every vote, precinct by precinct.

Every U.S. presidential, Senate, House and governor race from 2000 to 2024 on one map. Compare any two elections, or draw your own districts.

Version 1.2.1 · macOS via the Mac App Store · Windows installer (.exe)
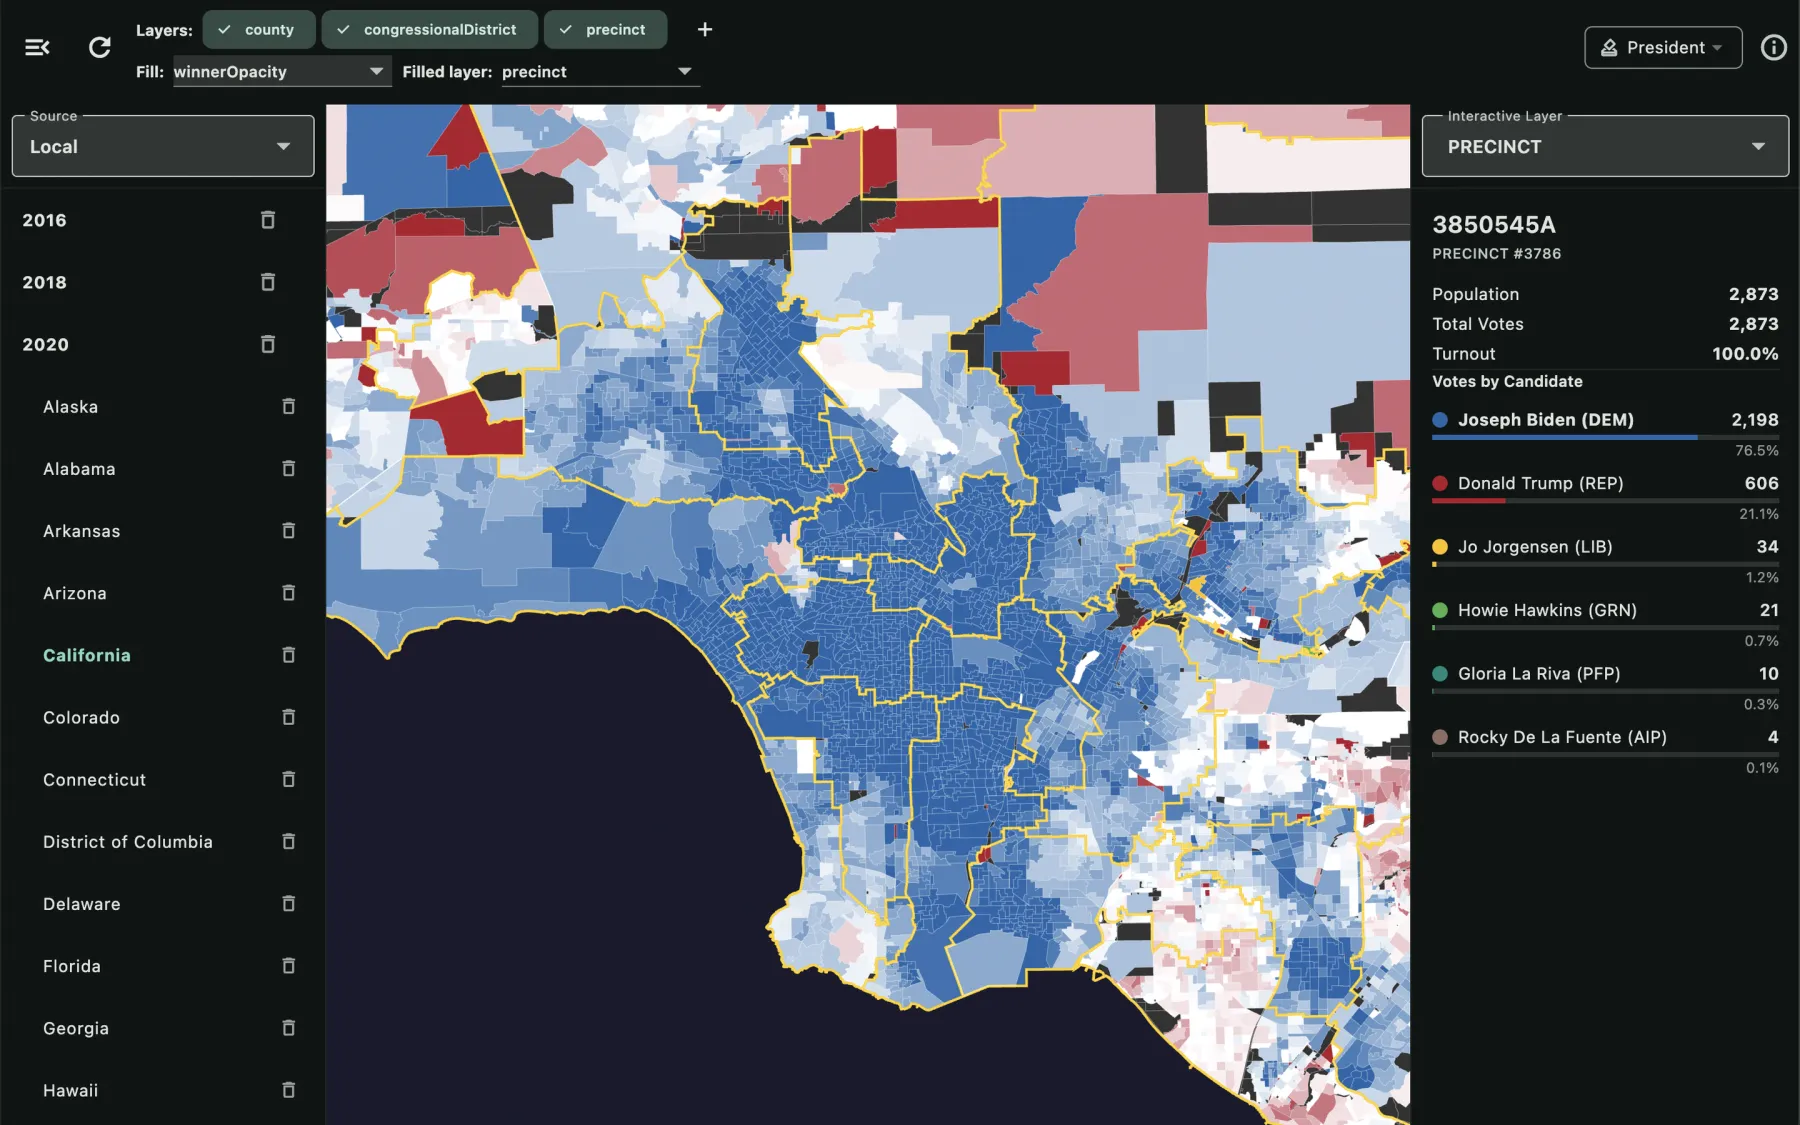
GerrymanderX showing 2020 presidential results for Los Angeles precinct by precinct, with the Inspector listing the vote breakdown of the selected precinct
2000–2024Every election year
4President, Senate, House, Governor
50 + DCStates, down to the precinct
7Ways to colour the map
Features

An atlas built for looking closely.

Pick a state and a year, and the map fills with the actual results. Hover to highlight a county, district or precinct; click it for the totals and the full candidate breakdown.

Precinct-level map

The real results, all the way down

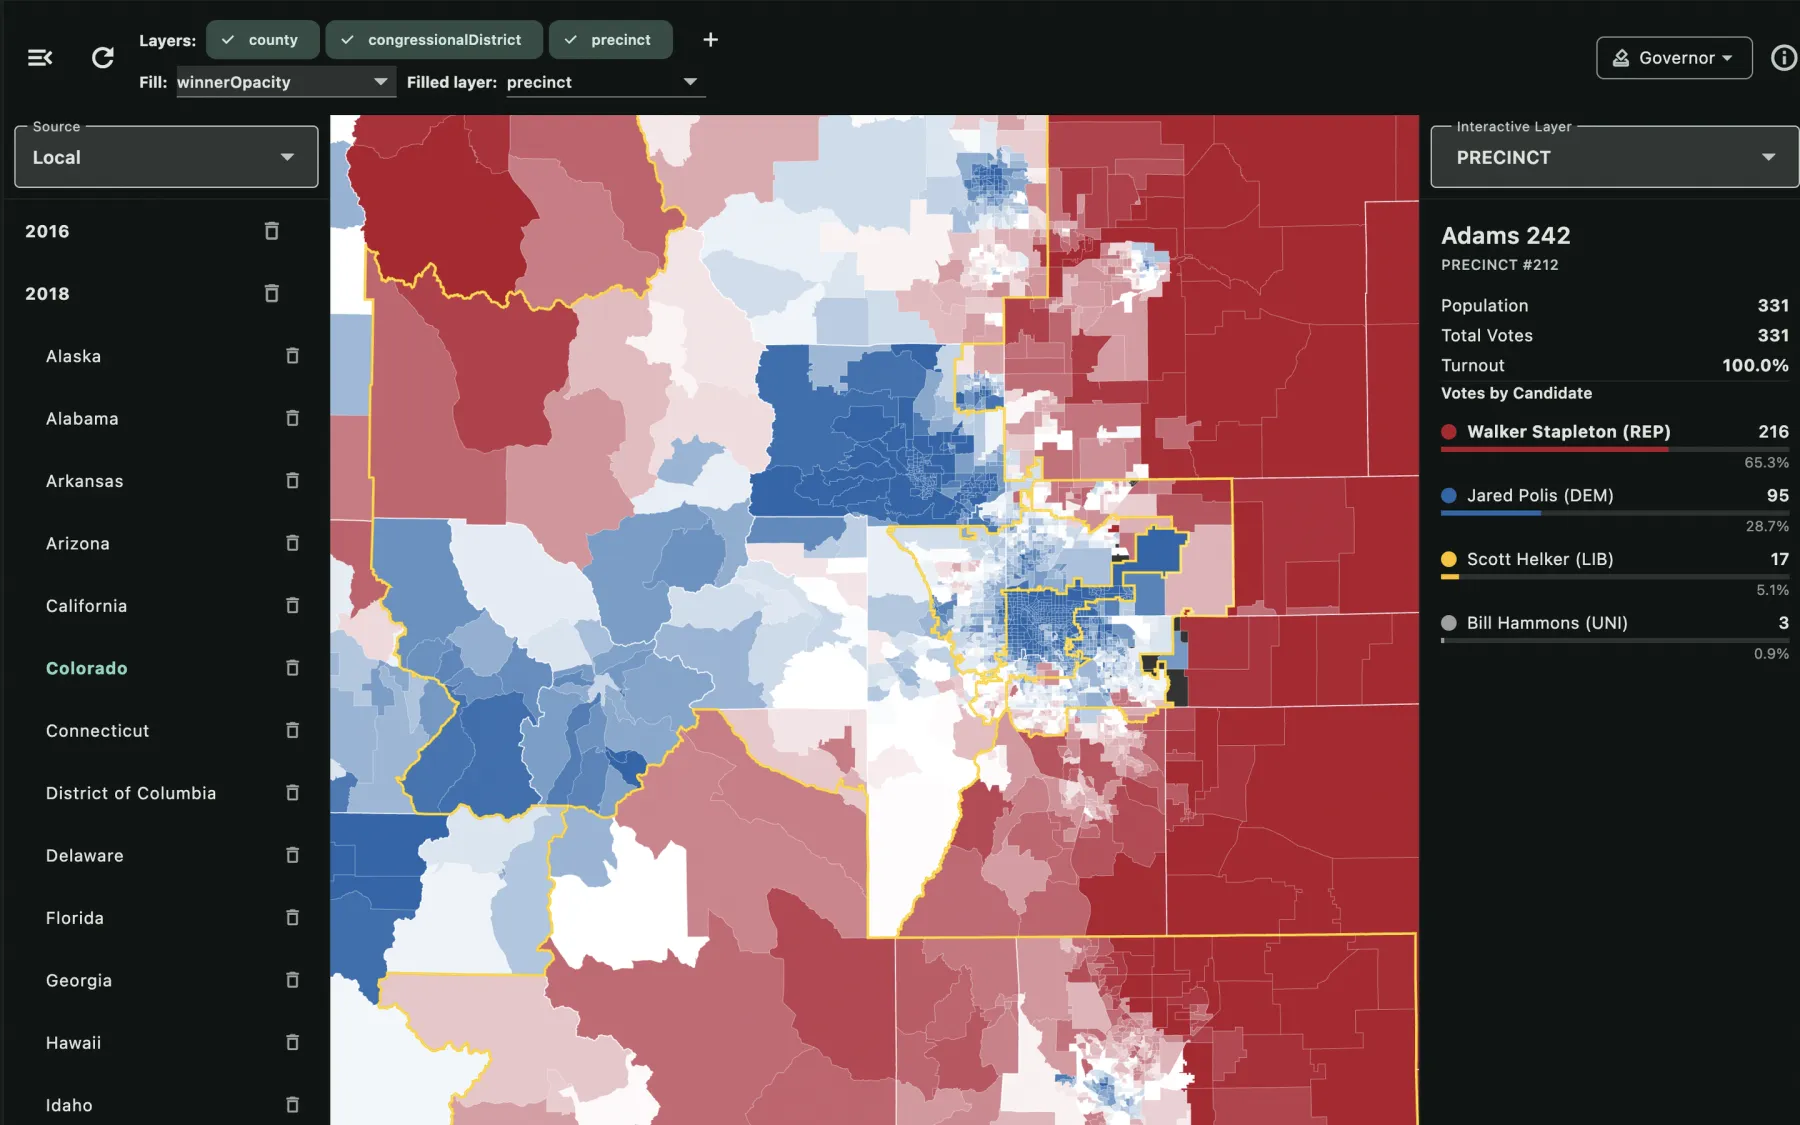
President, US Senate, US House and Governor for every election year from 2000 to 2024. The Inspector shows population, total votes, turnout and every candidate's share for whatever you click.

  • Toggle county, congressional district and precinct layers independently
  • Choose which layer is filled; keep district lines readable on top
  • Borders stay crisp at any zoom
Colorado 2018 governor results by precinct, with congressional district lines in gold
Compare two elections

See exactly where the vote moved

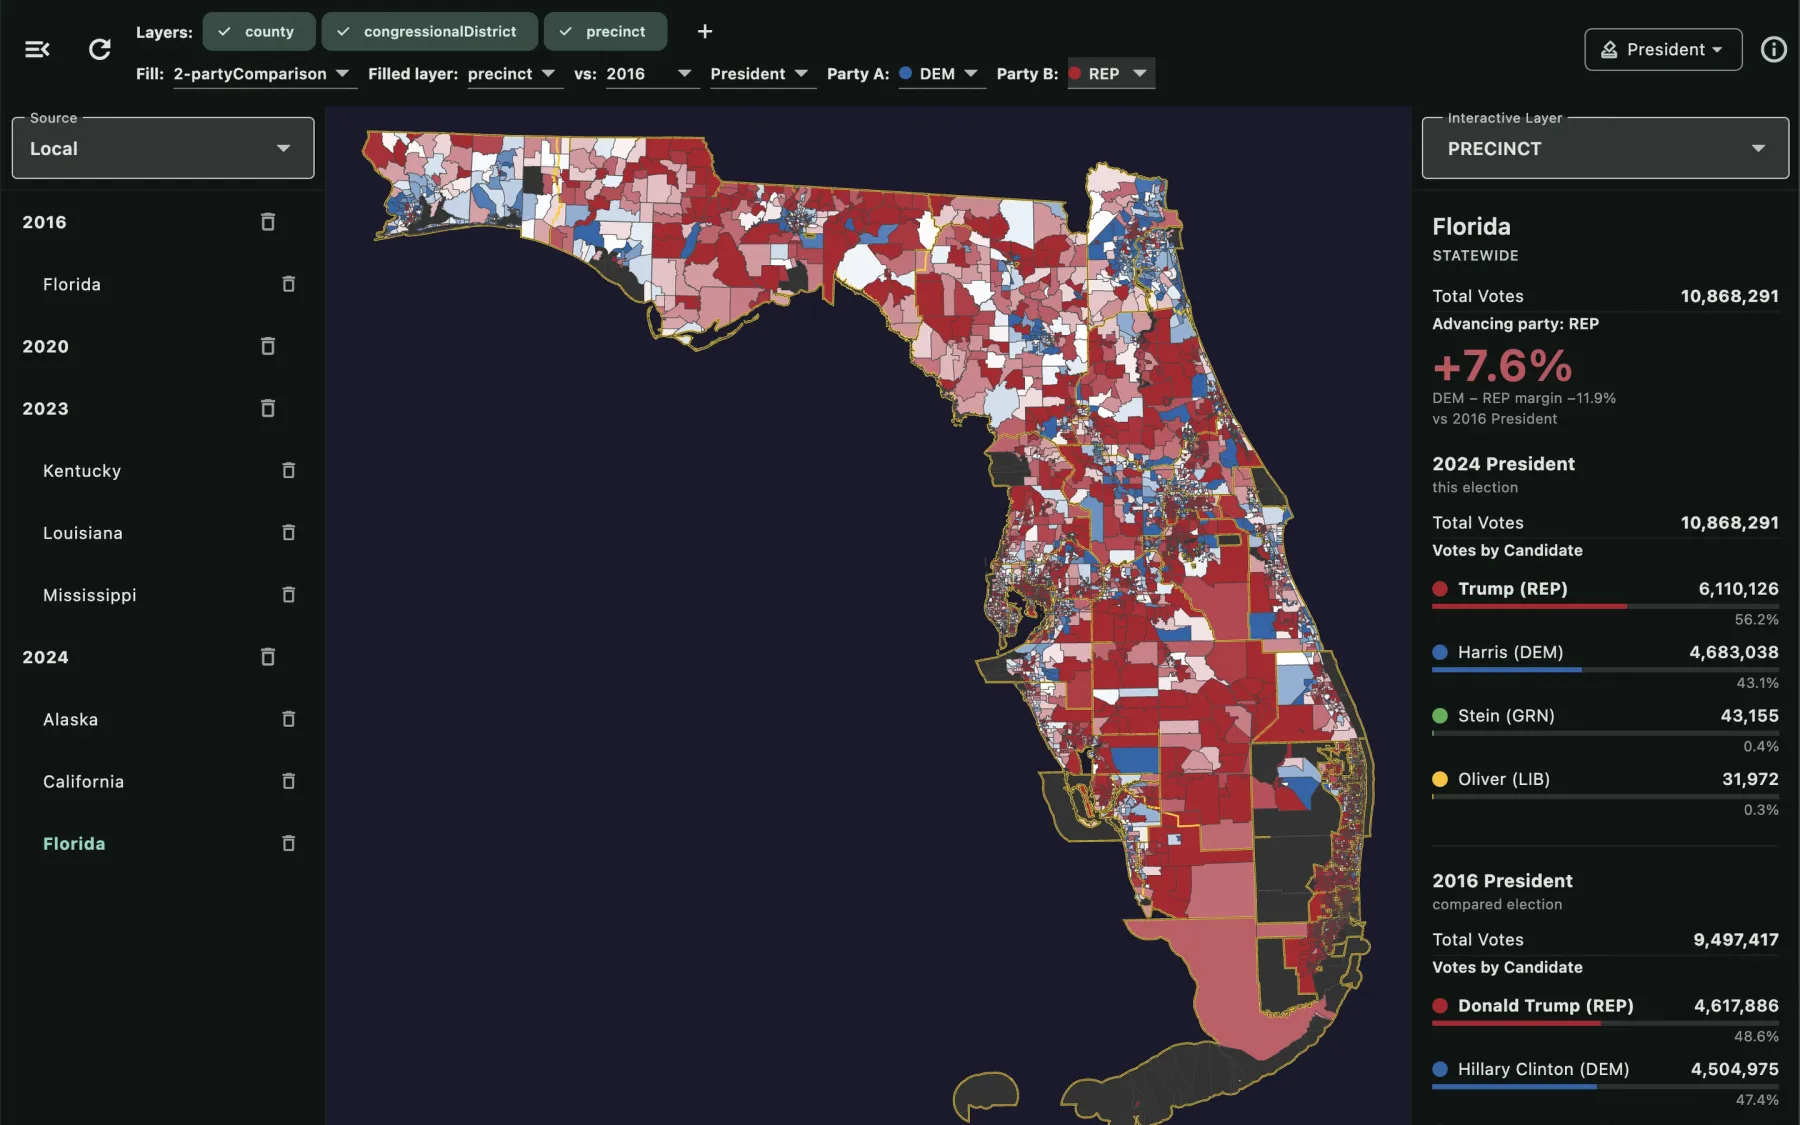
Put 2024 President against 2020 President, or against the same year's Senate race, and every region is coloured by the swing.

Parties are matched by name; counties and districts are matched on the ground — so a district redrawn between the two elections is still compared over the same territory. The Inspector shows both elections side by side, for a selected region or the whole state.

Florida two-party comparison of the 2024 and 2016 presidential elections, showing a 7.6 point Republican swing statewide
Custom layers

Draw your own districts

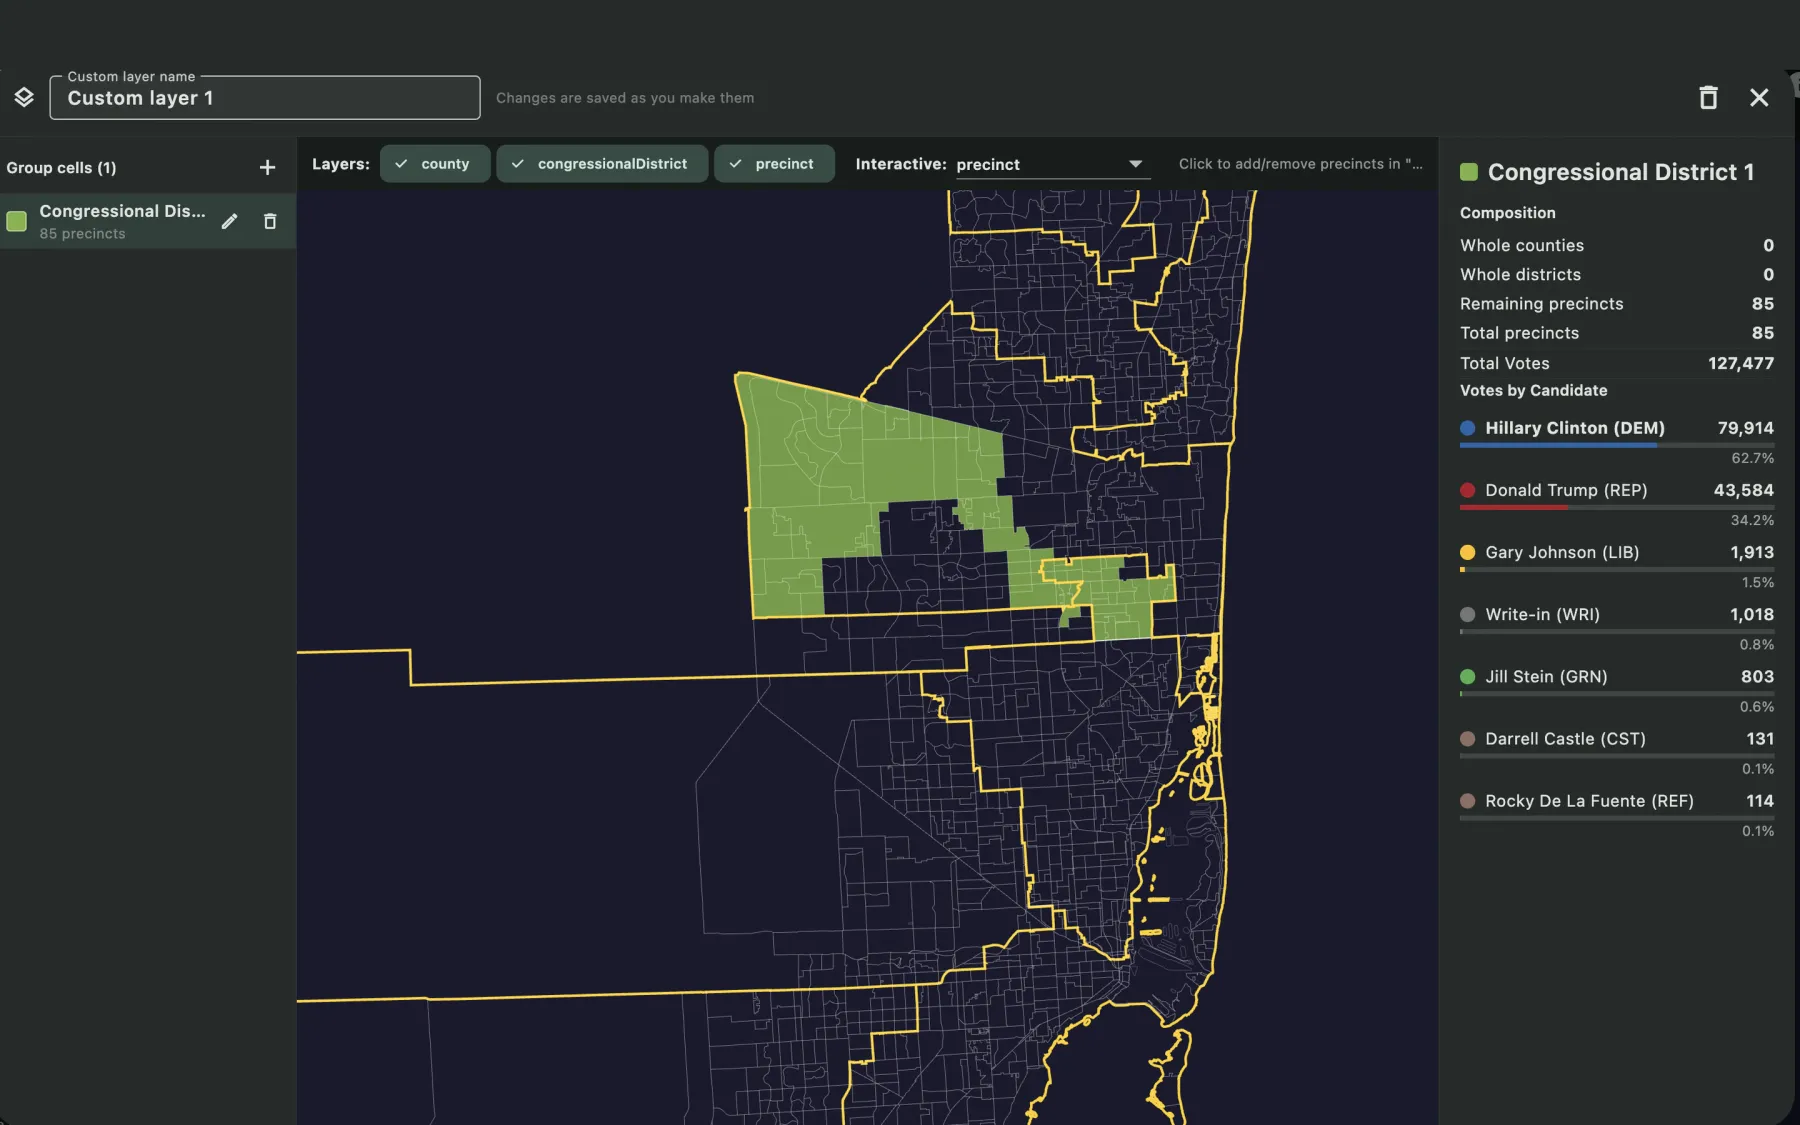
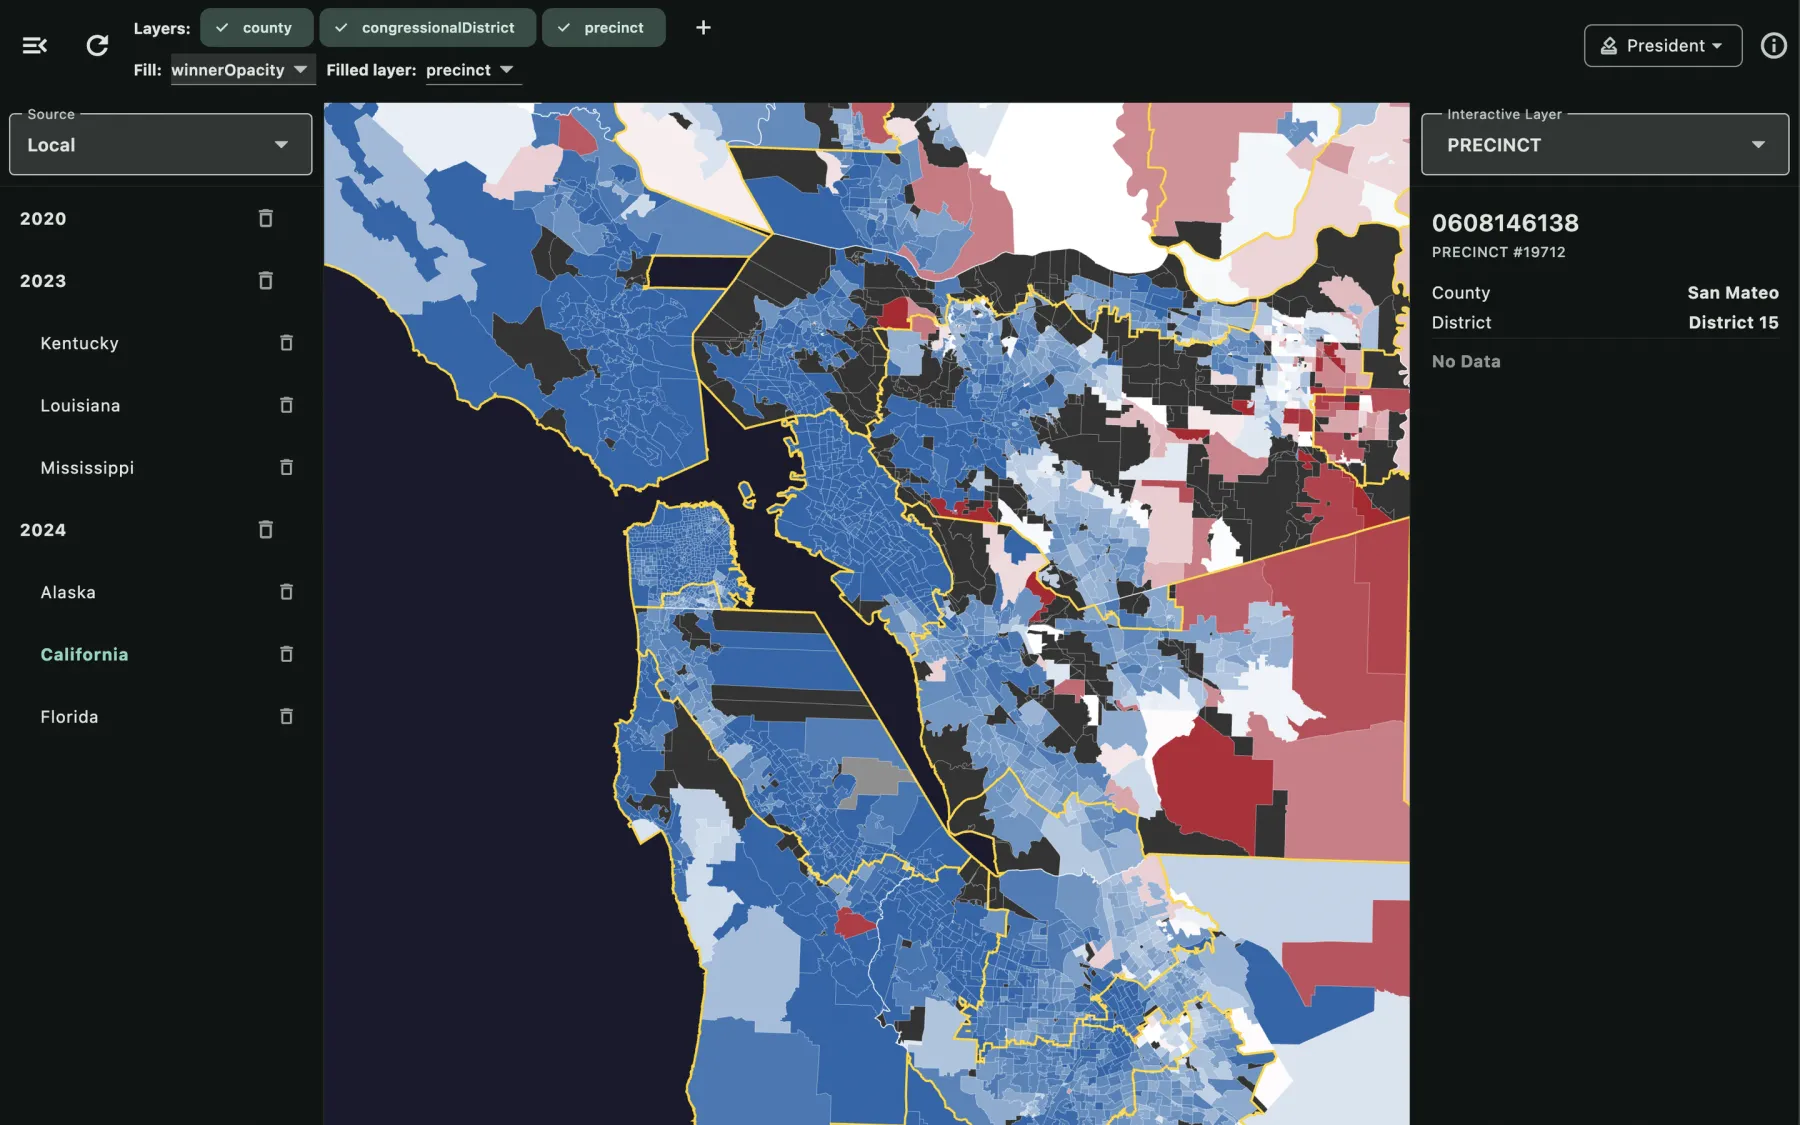
A custom layer is your own set of named, coloured groups of precincts. Click counties, districts or precincts on the editor map to add them to a group, and the totals update live.

A fast way to sketch an alternative district, a neighbourhood, or any area you want numbers for. Layers are saved as you draw and stay on your computer.

Custom layer editor with a group of 85 precincts in South Florida and its live vote totals
US House

Seat by seat

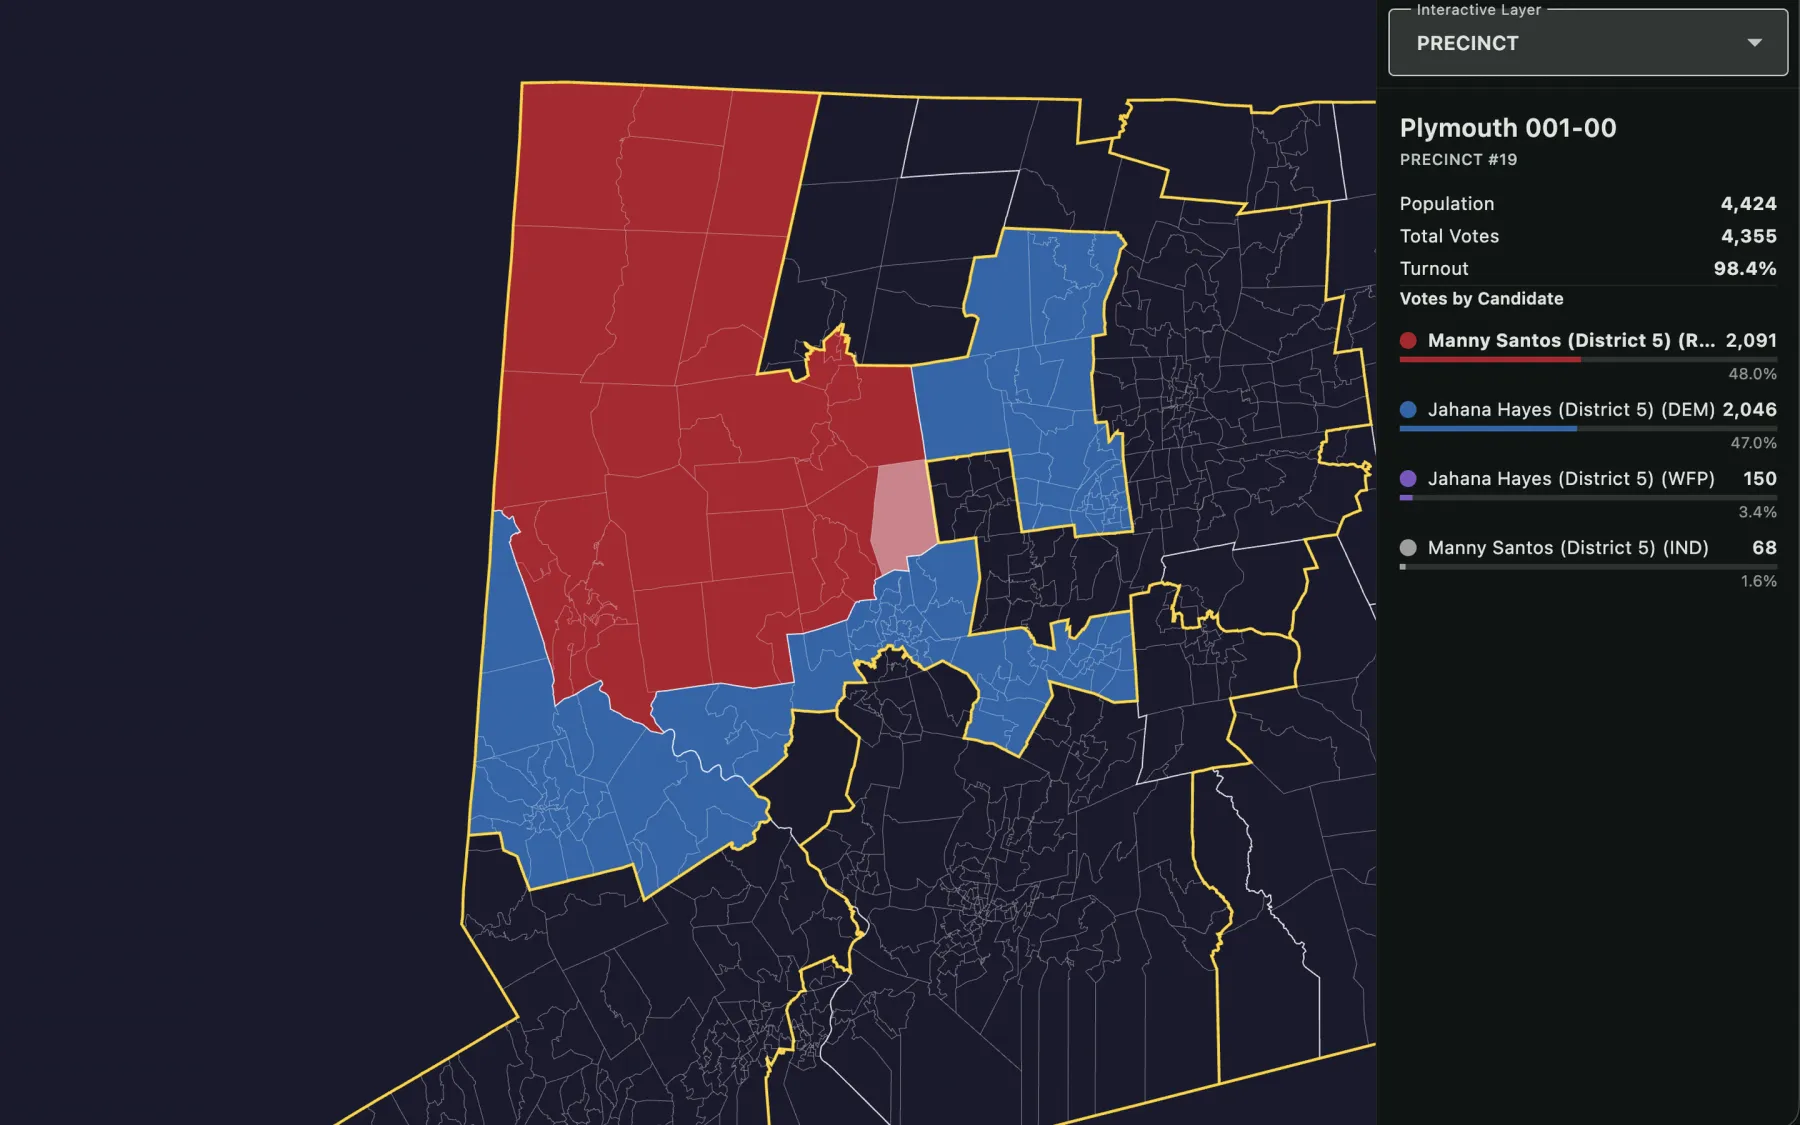
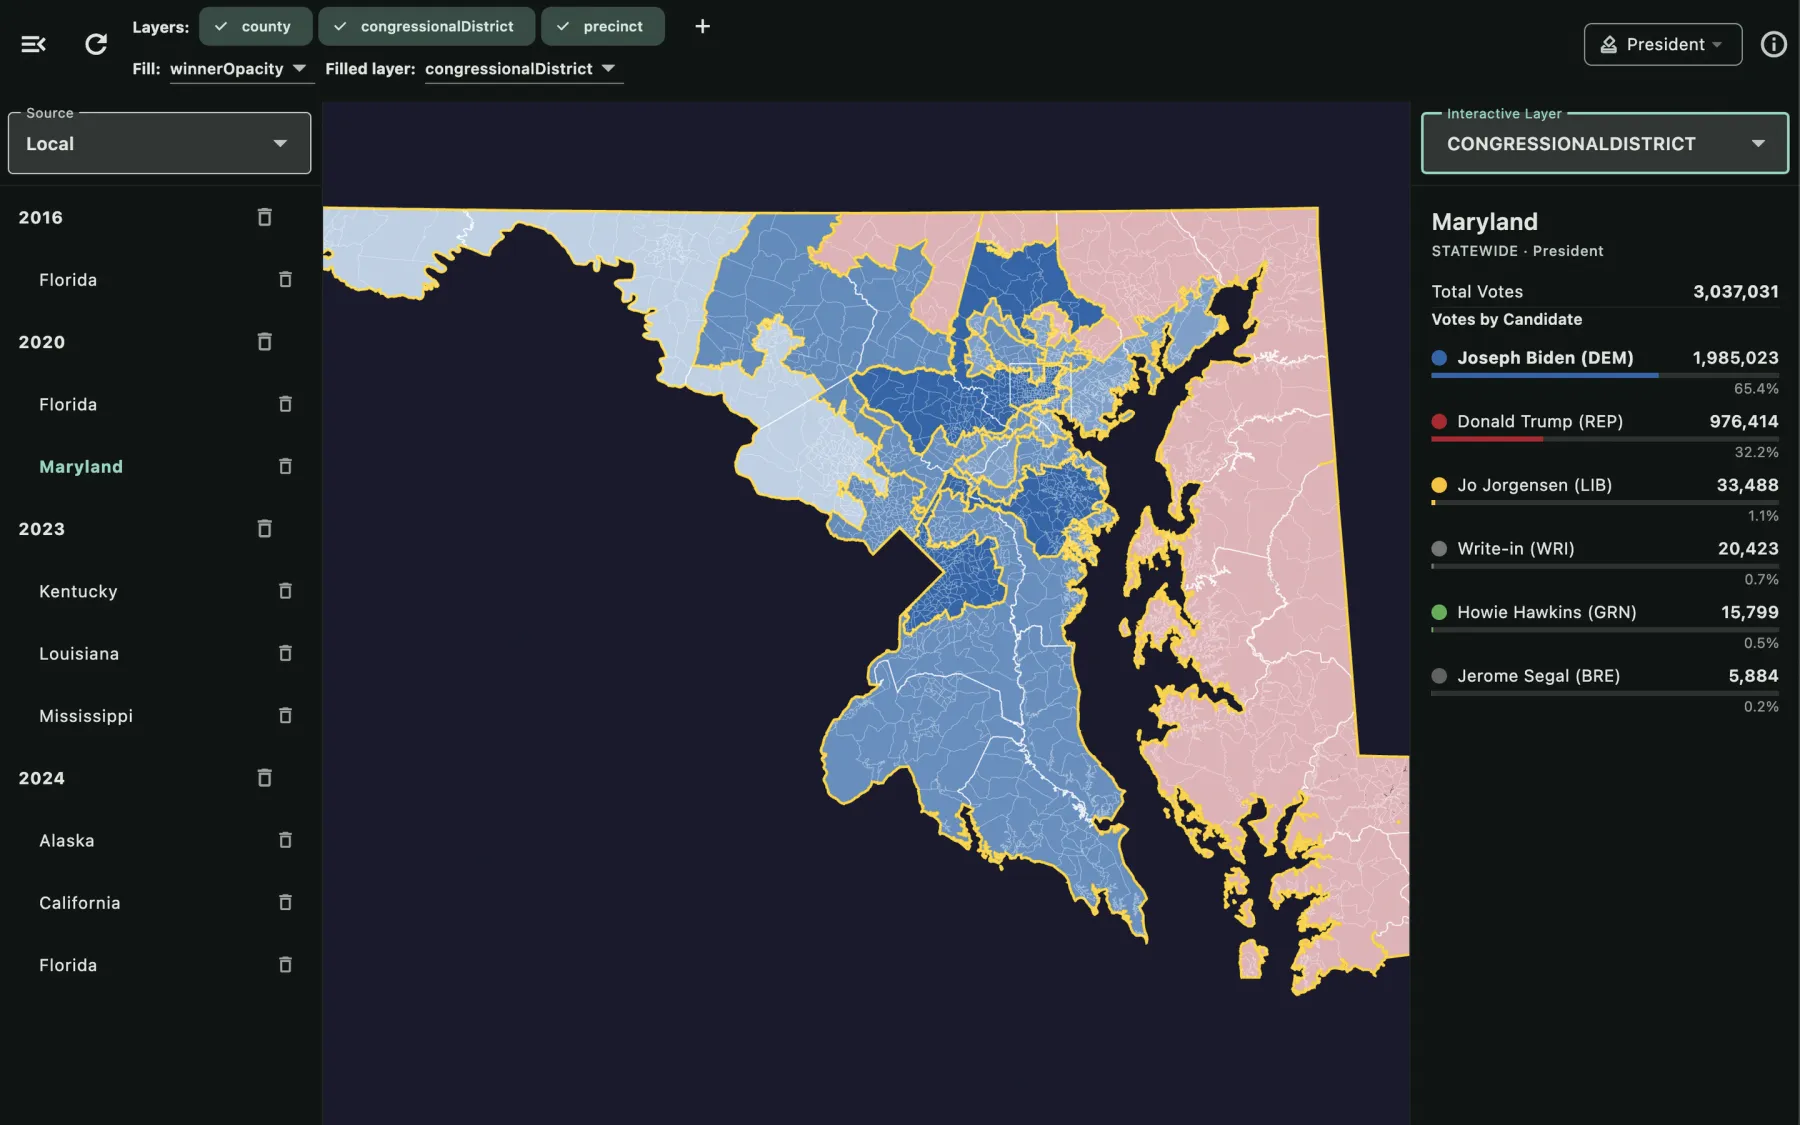
For a House race the statewide view opens with the seats won by each party. Only See isolates one congressional district: everything outside it fades to outlines, the candidate list narrows to that race, and the Inspector shows the district's winner.

Connecticut's 5th congressional district isolated, with a precinct selected showing the House race breakdown
Data on demand

Download only what you use

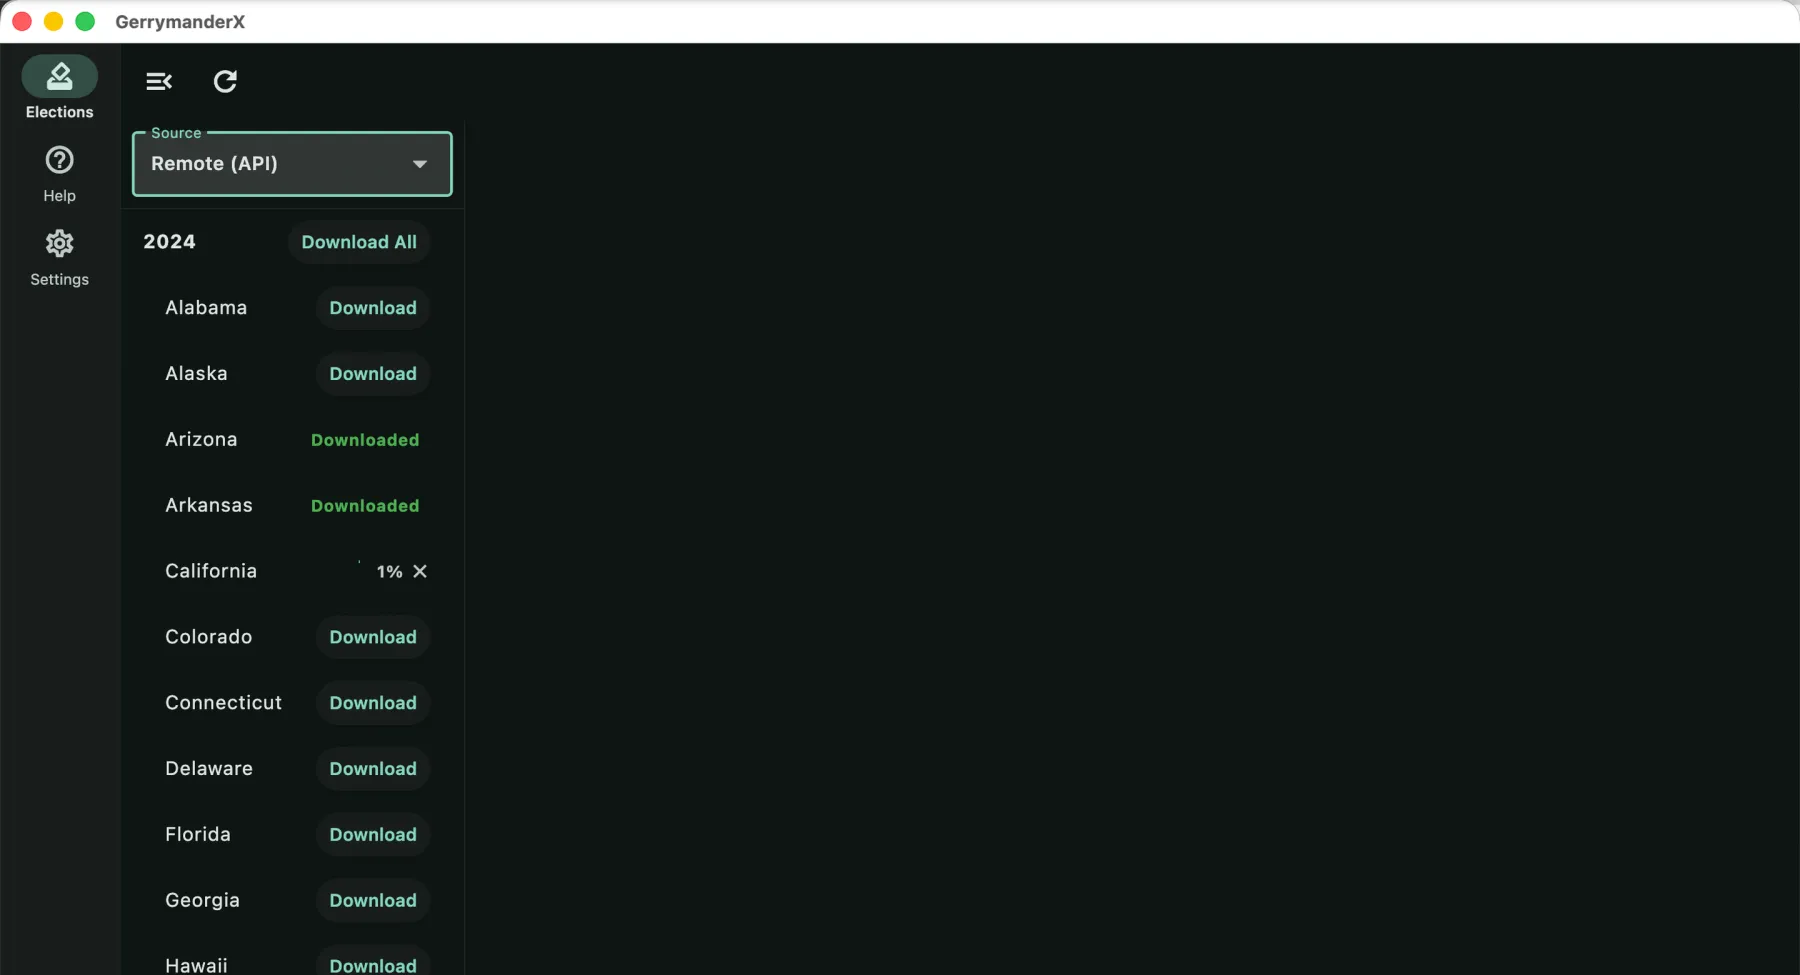
Election databases aren't bundled. Download the states and years you want — one file per state and year, holding every contest that state held — or grab a whole year at once.

When a corrected database is published, the state gets a red dot and an Upgrade button. Nothing is replaced until you choose.

The remote election list, with per-state Download buttons and download progress
Fill modes

One map, seven ways to colour it.

Switch the colouring in one click to answer a different question about the same results.

Winner

Solid party colour for whoever carried each region.

Winner by share

Fades with the winner's share, so a landslide and a squeaker look different.

Single candidate

Darker where one chosen candidate did better.

Dot density

One dot per region, sized by the winner's vote count.

Single-party comparison

How much one party's share moved against another election.

Two-party comparison

How the margin between two parties moved.

Boundaries only

Clean outlines for tracing districts over a neutral base.

Privacy

No account needed. No tracking.

Everything works without signing in. Your data stays on your computer.

Sign-in is optional

If you prefer an account, sign in with Apple or Google. Sign in with Apple lets you hide your email, and you can delete the account from Settings at any time.

Stays on your computer

Databases, custom layers and settings are stored locally and never uploaded.

No analytics, no ads

No tracking SDKs, no crash reporters, no advertising. Read the full privacy policy.

Where the numbers come from. Precinct results and boundaries from the Voting and Election Science Team (VEST) and the MIT Election Data + Science Lab (MEDSL), with precinct outlines completed from state and county GIS layers where the sources left them out. Years published only at county level use counties as their precincts, split along district lines for House races. State, county and district boundaries come from the U.S. Census Bureau. Precincts with no reported results are marked “No Data”, and unpopulated land is marked “No residents” rather than coloured as a result.

Explore 24 years of American elections.

Available for macOS and Windows. An internet connection is needed to download election data.

Version 1.2.1